
The longer you’re in crypto, the more you hear the same debate: technical analysis vs fundamental analysis. Which one actually helps you make better choices? The real answer is less “either/or” and more “use the right tool for the job.” Below is a practical map of technical analysis crypto and fundamental analysis crypto, complete with trusted references and a step-by-step way to combine them for a calmer, more consistent process.
What is technical analysis? What is fundamental analysis?
Technical analysis (TA) studies price and volume to spot trends, momentum shifts, and crypto patterns(support/resistance, moving averages, chart formations). Think of TA as timing: when to act based on the tape. Investopedia’s primer puts it simply: TA focuses on trading activity—price and volume—to identify opportunities and entries/exits.
Fundamental analysis (FA) tries to estimate intrinsic value using economic and project-specific data. In equities that’s cash flows and balance sheets; in crypto it becomes network activity, token economics, and macro forces. Investopedia defines FA as assessing underlying conditions (economy, issuer fundamentals) to judge if an asset is mispriced.
CFA Institute has long contrasted the two: TA looks to price/volume behavior; FA looks to drivers of value—both can be integrated in a research process.
How these frameworks translate to crypto
Technical analysis in crypto
- Trend & momentum tools: moving averages (MA/EMA), RSI, MACD, Bollinger Bands, Fibonacci retracements, candlestick analysis. These aim to filter noise and identify trend vs range. Academic and practitioner work continues to test indicator efficacy in digital assets.
- Volume analysis in crypto: because liquidity is fragmented across venues, read volume with care. Kaiko shows fragmentation still causes price discrepancies and slippage spikes during stress—so you want to watch depth and spreads in addition to raw volume bars.
- Market microstructure context: “why did that wick happen?” Often, depth vanished. Kaiko’s weekly notes document order-book thinning during sell-offs; S&P Global highlights the liquidity differences between CEXs and DEXs. For volume analysis crypto, that context is gold.
Fundamental analysis in crypto

- On-chain activity: addresses, active users, fees, throughput, and value transferred. Glassnode’s documentation covers core on-chain concepts and metrics libraries.
- Token economics & supply: issuance schedules, unlocks, burn mechanics, treasury and governance.
- Valuation proxies: classic example is NVT (Network Value to Transactions)—market cap divided by on-chain transfer volume—popularized as a crypto analogue to a P/E ratio. When NVT is high, the network’s price may be rich relative to usage; when low, it may be cheap. Glassnode’s guide explains the intuition and limits.
- Sentiment gauges: the Crypto Fear & Greed Index compresses vol, momentum, social, and dominance data (Bitcoin price-focused) into a 0–100 score—useful as a contrarian check, not a trade signal.
Where technical analysis shines
Strengths
- Gives you structure: trend, levels, risk points—useful for trade planning and risk management.
- Captures behavioral effects. Research shows retail flows in crypto can trend with momentum more than in other assets, which is exactly what TA tries to harness.
Weak spots
- Indicators can overfit noisy markets.
- Signals ignore fundamentals; a chart can look bullish into a token unlock or bearish just before a catalyst.
- Volume/price signals can distort when liquidity thins or fragmentation widens spreads (weekends, off-hours).
Practical fix: pair TA entries with a liquidity check (depth, spread on your venue) and a fundamental sanity check(unlock calendar, governance votes, on-chain usage trend).
Where fundamental analysis shines
Strengths
- Builds conviction beyond daily noise—crucial for longer-horizon positioning.
- On-chain metrics provide transparent usage data that doesn’t exist in traditional markets. Tools like NVT and activity/fee trends help frame what is Bitcoin analysis or any L1’s health.
Weak spots
- Crypto “intrinsic value” is fuzzy; cash flows are rare.
- Metrics lag or can be gamed (wash transactions, airdrop farming).
- FA often misses timing; a great network can underperform for months without a flow catalyst.
Practical fix: map FA insights to clear invalidation points on the chart. If your thesis is “usage up, fees up,” where does price tell you you’re early or wrong?
A blended playbook you can use tomorrow
- Start with a macro & sentiment scan
- Note crypto beta drivers (rates, USD, risk appetite).
- Check the Crypto Fear & Greed Index for crowd heat—extremes often coincide with worse forward returns. Don’t trade the meter; use it to throttle aggressiveness.
- Run a quick fundamental screen
- For BTC/majors: trend in active addresses, fees, transfer volume; sanity-check NVT. For alt L1s: dev activity, staking, ecosystem releases. Glassnode’s docs outline the major series; pick two or three you trust and track them consistently.
- Mark the chart (TA) for timing
- Identify structure: trend, key moving averages, daily/weekly levels, recent crypto patterns (breakouts, failed breakouts).
- Use volume analysis with a liquidity lens: has market depth improved or vanished? Kaiko’s research explains why fragmentation can exaggerate wicks—be extra careful during thin sessions.
- Write the plan in one sentence
- “Buy the pullback to the 200-day with Fear & Greed < 40 and NVT easing; stop under the prior swing low.” This forces TA + FA + sentiment into a single, testable idea.
- Review post-trade
- Did the FA thesis (usage, fees, flows) evolve as expected?
- Did TA levels behave? If you were shaken out by a slip in depth, consider reducing size or using time-based stops next time.
Useful Tools for Your Crypto Analysis
Here’s a compact toolkit you can keep open while you research, time, and execute crypto trades—each item plays a specific role in your workflow.
- Charting & price action (TA): TradingView.
For multi-timeframe charts, custom indicators, alerts, and watchlists. It’s the default “canvas” for most traders. (Download apps only from the official TradingView site—avoid third-party “premium” app scams reported in the wild.) - Liquidity & order-book quality: Kaiko.
Before relying on a breakout or volume spike, sanity-check the market’s depth and fragmentation. Kaiko’s liquidity rankings and research show how spreads, depth at 0.1–1%, and venue dispersion can distort signals—especially during stress. - On-chain fundamentals: Glassnode & Coin Metrics.
Use them to track active addresses, fees, transfer volume, supply schedules, and valuation proxies (e.g., NVT). Their docs outline coverage across hundreds of assets and explain how the metrics are constructed. - Sentiment check: Crypto Fear & Greed Index.
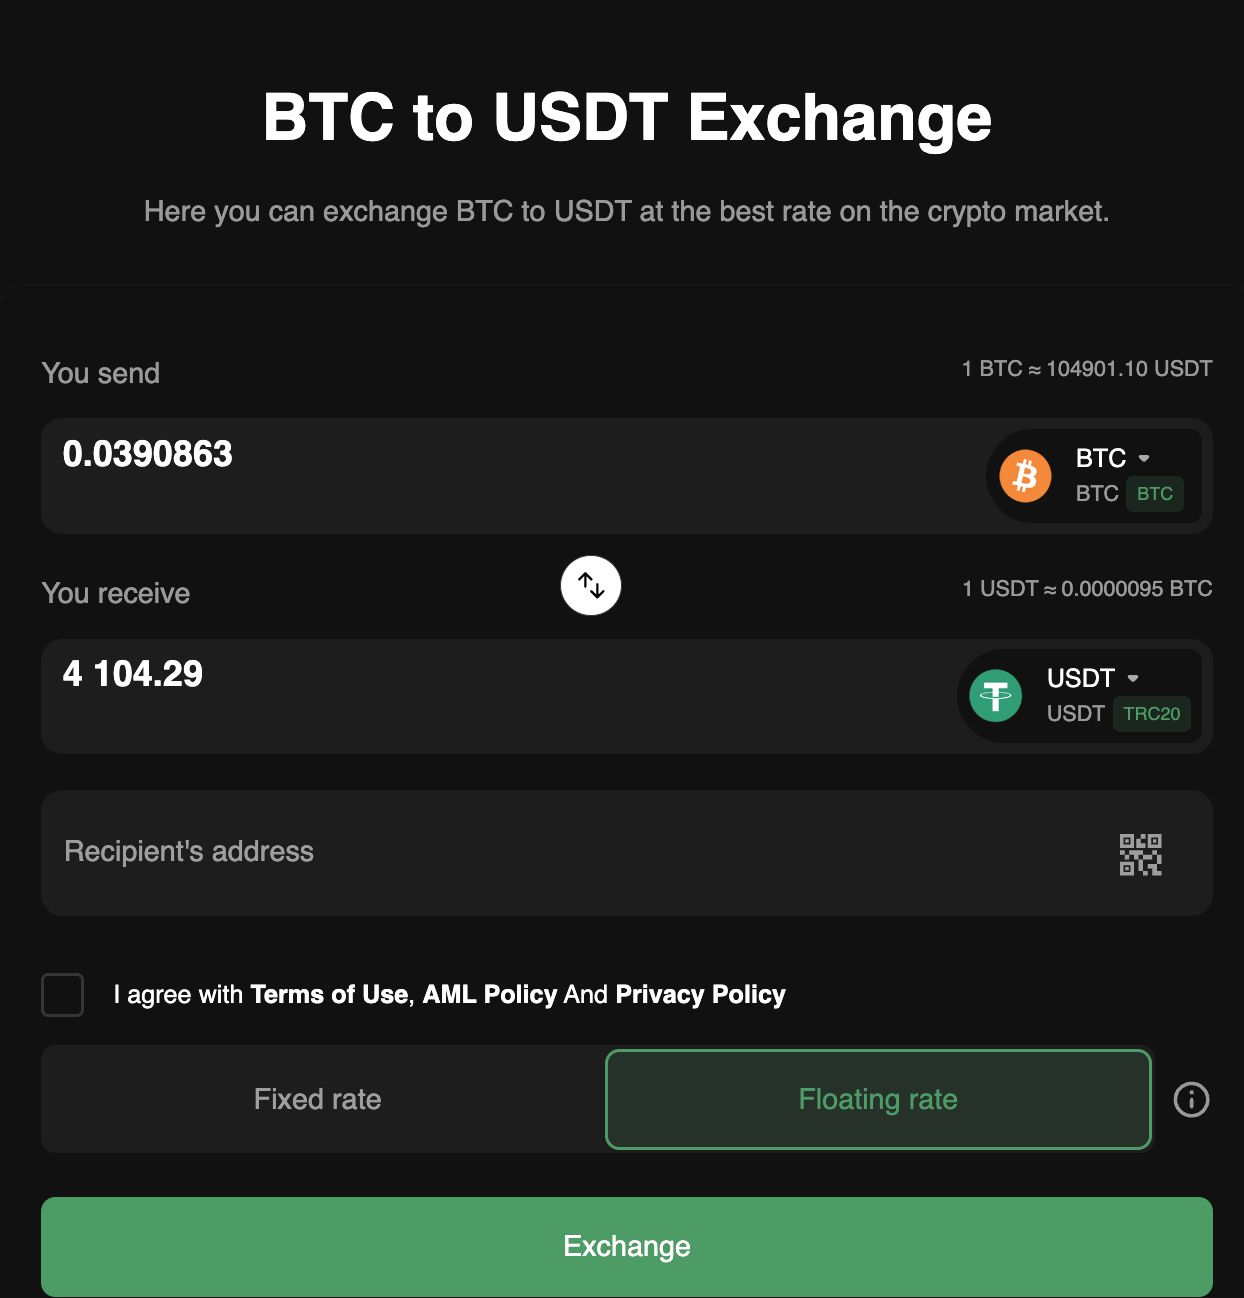
Use it as a throttle, not a signal. Extreme readings (fear/greed) can help you size conservatively or require better setup quality. Historical and real-time meters are available. - Execution after analysis: Revbit.
Once your TA/FA checklist is done, you may want a quick wallet-to-wallet swap without opening an order book. Revbit is a centralized exchange service focused on fast crypto-to-crypto conversions—enter an address and amount, and exchange BTC to USDT with transparent terms.
Final thoughts
If you came here for a verdict, here it is: use both. TA alone can mislead you into chasing noise; FA alone can leave you early, stubborn, and down bad while you wait for the market to agree. A blended crypto market analysis—price/volume for timing, on-chain and token economics for conviction, and sentiment for a sanity check—puts you in the minority of traders with a process.
In a market that trades 24/7 and forgets headlines by Monday, your edge isn’t a mystical indicator or a magical multiple—it’s a repeatable blend of technical analysis, fundamental analysis, and liquidity awareness that you can execute calmly, week after week.